

Thermal imaging basically involves using infrared radiation to identify temperature variations. Add drones to the set up and you can get this done with an aerial viewpoint. Search and rescue teams use this to locate missing people in areas like forests. Law enforcement use it for patrols and tracking individuals in the dark. Even firefighters use it to identify hotspots.
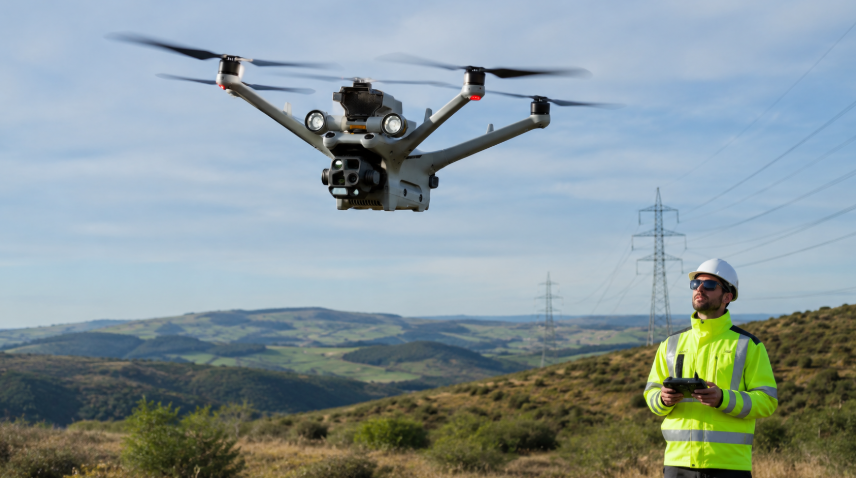
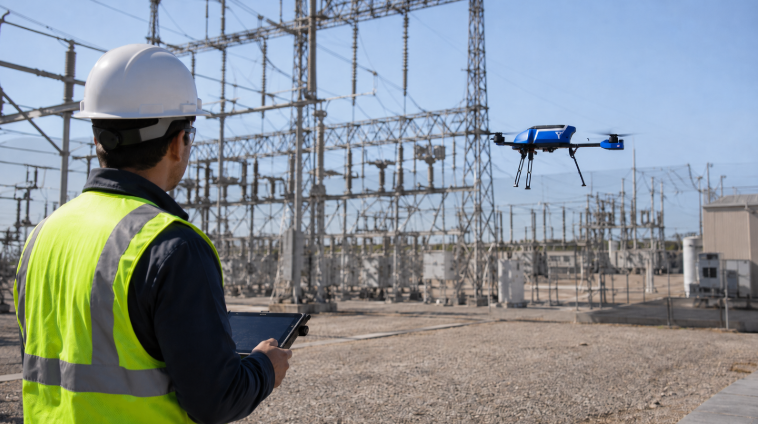
When it comes to industrial inspections, the drone thermal imaging tools are a core part of ensuring machinery safety, pinpointing energy inefficiencies, or identifying structural weaknesses. That way inspectors can locate issues such as overheating, insulation gaps, and fluid leaks without invasive methods.

DJI drones are widely used, and this guide specifically focuses on getting the most of of them during your inspections. This will involve the DJI Thermal Analysis Tool designed to analyze and process images captured by the brand’s devices.
Compatible Hardware for the DJI Thermal Analysis Tool
The DJI Thermal Analysis Tool 3 is designed to complement a select range of hardware optimized for capturing R-JPEG thermal images. Supported hardneware include::
- DJI Matrice Series: e.g. Matrice 3TD, Matrice 30T
- DJI Mavic Seriese: e.g. Mavic 3T, Mavic 2 Enterprise Advanced
- Zenmuse Payloads: e.g. H20N, H20T, H30T, XT S
These models maximize the tool’s functionality. Devices like the DJI Matrice 3TD come with high-definition thermal imaging. Payloads like the Zenmuse H30T enables you to measure temperatures in a range from -40° to 80°C (-40° to 176°F). You can use this payload on the flagship Matrice 350 RTK drone.
Latest version: DJI Thermal Analysis Tool 3.
Calibrating DJI Drones For Thermal Inspections
- Distance to the target: The camera’s default calibration distance matches your target distance. The factory-calibrated distance provides the highest accuracy. Moving too close or too far increases errors.
For example, if your camera’s optimal distance is 10 meters and you deviate sigificantlly, this will reduce the precision of your measurements.
- Relative humidity: The environment’s humidity impacts how the camera interprets temperature, which is particularly an issue in areas like power plants which have high humidity. The tool is adjustable between 20-100%, compensating for atmospheric conditions that may affect readings.
The default is 70%, but ensure this matches the actual humidity in the inspection environment. That way you can minimize distortions in readings.
- Emissivity: Emissivity refers to how well the target surface emits thermal radiation. Match this setting to the material you’re inspecting Surfaces like oxidized metals may reflect differently than clean ones. Use an emissivity reference table, but adjustments may be needed for real-world conditions.
Here are emissivity values for common materials (Values are based on measurements at 0 °C but are generally consistent at room temperature).:
- Aluminum, polished: 0.05
- Brick, common: 0.85
- Copper, polished: 0.01
- Gold, polished: 0.02
- Iron, hot rolled: 0.77
- Lead, shiny: 0.08
- Paint, oil, average: 0.94
- Steel, rolled freshly: 0.24
- Water: 0.98
- Ice: 0.97
Misjudging emissivity leads to significant measurement errors. For instance, uncalibrated emissivity on corroded pipes can skew temperature results by over 10%.
- Reflected Temperature: Consider surrounding objects’ temperatures to prevent inaccurate readings.This is to account for radiation bouncing off nearby surfaces. In environments with extreme temperatures—like near boilers or refrigerated tanks—this reflection distorts measurements.
If surrounding objects are stable, set the reflected temperature to match the ambient temperature. However, if extreme conditions exist, customize this setting to avoid incorrect data interpretation.
- Ambient Temperature: Ambient temperature refers to the air temperature between the camera and the inspection target. DJI’s software automatically detects it using sensors, but manual input might be required in fluctuating environments.
For example, if inspecting outdoor pipelines in direct sunlight, the auto-detected ambient temperature might need manual adjustments to account for heat radiating from the sun.
Related Reading: Top 14 Thermal Drones Based On Imaging Systems & Flight Performance
Choosing the Right Palette for Industrial Inspections
The palette selector ensures your thermal images are as clear and actionable as possible.
- Start with White Hot. It’s the most commonly used palette for a reason. High temperatures are white, and low ones are black, which makes it intuitive. For general-purpose inspections, like identifying overheated equipment, this palette simplifies interpretation.
- For more detailed analysis, consider Iron Red. This palette highlights nuanced heat differences, making it ideal for spotting thermal anomalies. For instance, if inspecting a power station, Iron Red can help detect a single faulty insulator among many.
- Looking for a palette that prioritizes high-temperature targets? Hot Iron is your go-to. Red dominates for high temperatures, while cool tones handle the rest. If you’re inspecting furnaces or boilers, this palette is perfect for pinpointing critical issues in seconds.
- Sometimes, you’ll deal with minimal temperature variations. In such cases, use Medical or Arctic palettes. Medical uses subtle contrasts to detect slight changes, while Arctic swaps purple tones for cool blues, making it better for environments like cold storage facilities or pipelines with small leaks.
- For complex inspections requiring both high and low detail, work with Rainbow 1 or Rainbow 2. Rainbow 1 prioritizes cooler targets with a reduced warm tone, while Rainbow 2 balances both ends of the spectrum. These palettes are excellent for scenarios like detecting structural weaknesses in bridges under thermal stress.
- .Need to focus on high-contrast environments? Tint is a bold choice. Bright red highlights high temperatures against black and white for lows. At night or in dim settings, Tint excels in detecting overheating machinery or electrical faults.
- Finally, Black Hot offers the reverse of White Hot. Warmer objects appear black, cooler ones white. This palette is particularly effective outdoors, where heat distribution needs clearer observation. For example, during pipeline inspections in open areas, Black Hot ensures precise data even under direct sunlight.

Example of different palates on the same image. Image Source: DJI
To make the most of your chosen palette, adjust the chroma bar settings. Drag its ends to narrow the temperature range. This highlights critical areas while reducing noise. For example, when inspecting electrical equipment, focusing on 60–80°C reveals overheating components immediately.

Thermal Analysis Screen. Image Source: DJI
Thermal Analysis Measurement Tools
Each measurement function offers unique insights:
Spot Temperature Tool
It measures the exact temperature of a single point. Left-click to mark the spot, and the reading appears instantly. Drag it across surfaces to find anomalies. For instance, if you suspect a hotspot in an electrical panel, this tool isolates the issue quickly. You can delete the point or adjust font size and annotations for clarity.
Rectangle Temperature Tool
Need to scan an area for temperature variations? The rectangle tool does just that. Create a rectangle by dragging across the screen. It displays the highest, lowest, and average temperatures within the marked area. If you’re inspecting a heat exchanger, use this tool to assess its performance across different sections. Resize and reposition the rectangle as needed.
Circle Temperature Tool
For round or irregular objects, the circle tool shines. Draw a circle over the target area, and it calculates the highest, lowest, and average temperatures. This tool is perfect for inspecting pipes, tanks, or valves. Adjust the circle’s size to fit the object. Like the rectangle tool, it keeps you informed about localized heat patterns.
Line Temperature Tool
Thermal gradients are critical in many inspections. The line tool helps you measure them. Drag a line across a surface, and the tool provides the temperature variation along its length – like highlighting areas of thermal stress or leakage during pipeline inspections.
Extra Tips to Get Quality Thermal Images:
- Stability: Keep your thermal camera steady. DJI drone typically come with 3-axis gimbal systems, which stabilize the camera across three planes of movement: pitch (tilt), roll (side-to-side), and yaw (rotation). This allows the camera to remain fixed on the subject, even as the drone moves through turbulent air or sudden gusts.
However, you should still avoid sudden maneuvers: While gimbals correct for motion, smoother flight paths reduce strain on the system.
- Clear Sightlines: Eliminate obstructions to maintain an unobstructed view of your target. This prevents errors in data interpretation.
Related Reading: Drones Are Taking Over Cell Tower Inspections—See How You Can Earn From It
Processing the Thermal Drone Images
Managing numerous thermal images is no small feat. The DJI Thermal Analysis Tool 3 simplifies this process by enabling batch operations. You can simultaneously:
- Edit multiple images to adjust parameters like emissivity or reflected temperature.
- Apply filters to isolate critical temperature ranges.
- Export comprehensive reports in PDF or DOC formats, complete with annotations and customized headers.

Common Mistakes to Avoid During Drone Thermal Imaging
Misinterpreting Data
Hot spots don’t always mean trouble. That glowing red patch? It might not be a fault at all. For example, machinery can naturally heat up during normal operation. Jumping to conclusions without context can lead to unnecessary repairs. Cross-check your findings with other inspection tools to avoid costly mistakes.
Neglecting Emissivity Settings
Different materials emit heat differently. A shiny metal surface won’t behave like a matte wall. Ignoring this detail can throw off your readings by more than 20%. Always adjust emissivity settings based on the material you’re inspecting. If you’re unsure, consult a reference chart for accuracy.
Overlooking Environmental Factors
High humidity, strong winds, or even sunlight can distort results. For example, wind can cool surfaces, making them appear colder than they actually are. Factor in these elements when analyzing images, or you might miss critical details.
Ignoring Maintenance
Dirty lenses can ruin everything. Smudges or dust can blur thermal images and misrepresent temperature readings. And outdated software? It can limit your tool’s capabilities. Regularly clean your lenses and keep your software updated. A small effort goes a long way in maintaining accuracy.
Related Reading: Relief for DJI Drone Users as U.S. Ban Delayed—For Now
Post-Inspection: Reporting and Analysis
- Focus on Key Metrics: Highlight temperature ranges, anomalies, and areas needing urgent attention. Include visuals with applied palettes for better understanding.
- Share Actionable Recommendations: Pair your findings with concrete solutions. For example, if a pipe’s insulation is failing, suggest specific materials for repair.
