
Sure, you can quickly identify turbine cracks on camera — but for bonding issues, thermal inspections are needed. Ultrasound on the other hand needs couplant and time you can’t spare. So, which tool goes first?
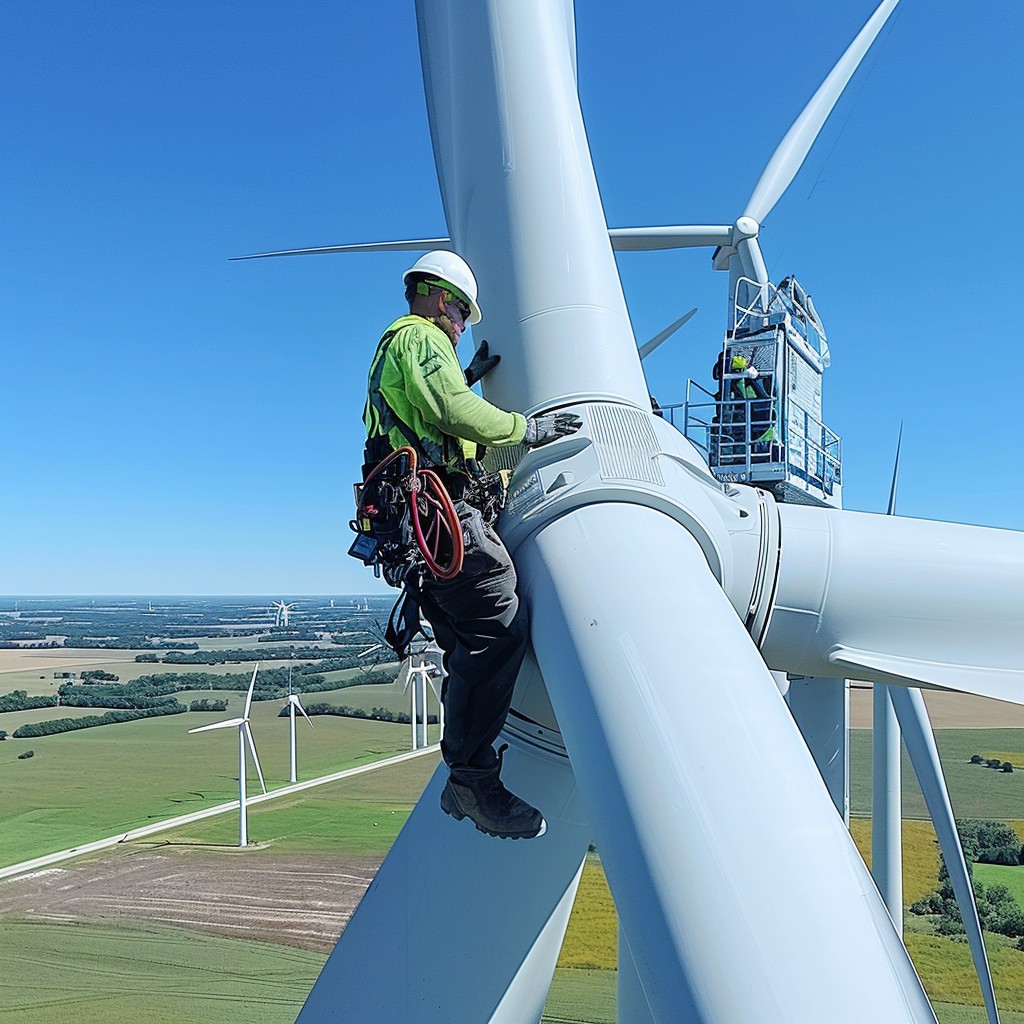
Your job is to keep turbines spinning safely. Issues like leading‑edge erosion (LEE) can dent energy production by 1–5% on average, with up to ~9% in severe scenarios. Those percentages land right on your P&L. How will you quickly find and fix defects?
You want a simple, repeatable rule set. One where you can detect surface wear early, catch hidden issues, and prove the extent before repairs begin. A blended NDT plan does exactly that.
What each method really gives you
Visual (optical/RGB)
Visual is your baseline. You’ll see leading‑edge erosion grades, gelcoat chalking and loss, longitudinal or transverse cracks, trailing‑edge splits, add‑on separations, missing or loose fasteners, tip‑cap and receptor condition, and lightning flashover marks. It’s quick and safe with drones, and it gives you clean context for every other finding. Most sites finish a full exterior set in ~45 minutes per turbine when routes and overlaps are standardized.
You also get usable evidence, not just photos. Stitched blade views make length and width measurements straightforward. Annotations tie each defect to exact locations on the blade, so planners can order parts and crews without a second visit. Year‑over‑year, those same views help you trend wear and see which repairs hold under weather and load.
The trade‑off: visual can’t read inside the laminate. When you suspect a spar or web issue, pair visual with thermal for a fast internal screen, then use ultrasound to size depth before cutting.
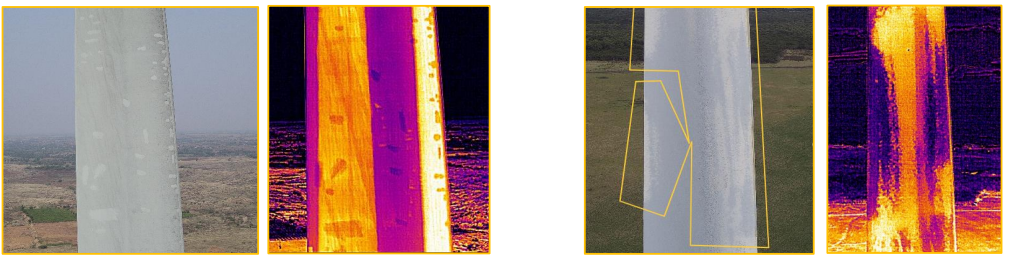
Optical and Thermal Images of Gelcoat/Paint Damage on Wind Turbine
Thermal infrared (IR)
Temperature patterns reveal delamination, bad bonding, moisture pockets, LPS path problems, and more. With tuned workflows, teams report ~3–4 mm detectability and sub‑surface visibility up to ~15 cm in blade composites. Thermal can be run day or night, and it fits that ~45‑minute field cadence.
Thermal comes in two flavors:
- Passive: ride natural heating and cool‑down. Great for quick site work in the right weather.
- Active: apply controlled stimulation for stronger contrast or repeatability.
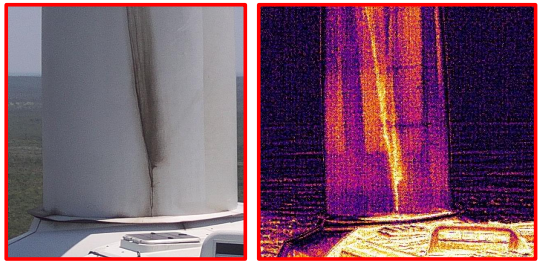
Comparing Thermal & Optical image of Cracks (Longitudinal) at Wind Turbine Blade Root
Ultrasound (UT/PAUT)
Ultrasound is for extra depth. It gives you quantitative proof. You can verify bond line integrity, measure adhesive thickness, map delaminations and disbonds, and size features with millimetre‑level resolution. UT also helps you catch tricky issues such as kissing bonds (weak adhesion without a visible gap), wrinkles near load paths, core crush in sandwich sections, and porosity around repairs. Use it when a repair decision carries real cost or safety impact.
You run UT on a stopped turbine with clean access. Surfaces should be free of loose paint and grime; a thin paint layer is usually fine. You’ll apply couplant (gel or water) and use low‑frequency phased‑array roller or wheel probes on thick GFRP to gain penetration on curved geometry. For data, you’ll read A‑scans for signal quality, B‑scans for depth profiles, and C‑scans for plan‑view maps. Expect clear outputs like bond‑width tables in millimetres, defect depth/extent, and go/no‑go calls tied to OEM or standard criteria.
Field reality matters. UT is targeted follow‑up, not a fleet screener. It’s slower than thermal and needs rope access or platforms, steady weather, and time to couple properly. So point it where visual or thermal already flagged risk—spar caps, shear webs, trailing‑edge joints, or post‑repair checks. You’ll get defensible numbers for scope, materials, and cure verification.
Good practice: work in short, well‑defined zones; calibrate on known references; log probe paths; and attach UT maps to your stitched blade views so planners, techs, and QA read the same evidence.
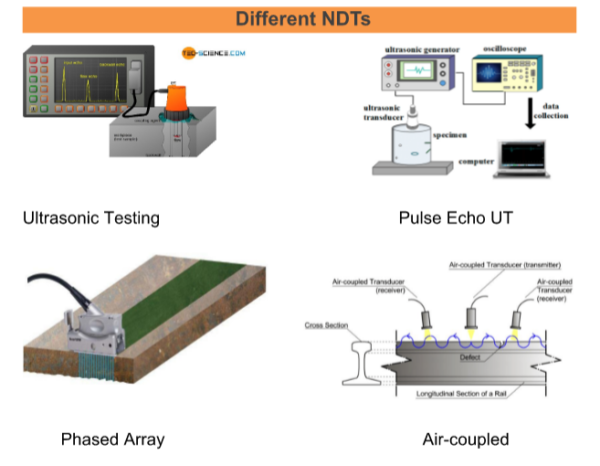
Image Source: ABJ Drones
| Your question | First step | Add when needed | Outcome |
|---|---|---|---|
| “Is anything wrong on this blade?” | Visual | Thermal | Fast screen, hidden issues flagged |
| “Is this bond failing?” | Thermal | Ultrasound | Evidence plus depth and width |
| “How bad is this erosion?” | Visual | Thermal | Severity map + sub-surface check |
| “Is there hidden lightning damage?” | Visual | Thermal | Flashover + internal heat paths |
| “Do we cut now or give it time?” | Thermal | Ultrasound | Data to repair or defer |
Use visual on every turbine, every cycle, to map surface defects and locations. Use thermal when time is short to screen the fleet and flag subsurface disbonds, moisture pockets, and LPS anomalies for triage. Use ultrasound when money or safety is on the line to measure bond width, depth, and defect extent, confirm repair scope, and verify post‑repair quality.
Say you’re dealing with leading-edge erosion after a stormy season. Start with visual to grade erosion. Where erosion meets joints or fasteners, add thermal to search for deeper trouble. Estimate Annual Energy Production (AEP) impacts using published ranges to justify timing. Target repairs first on the worst 1–5% AEP loss candidates.
On the other hand, if it is a case of recurrent lightning events, use visual to document flashover and receptor condition. Use thermal to look forward/back along the LPS path for hidden heat signatures. If you see subsurface red flags near structural glue lines, confirm with ultrasound before cutting.
Reporting that gets work done
Strong data still needs strong reporting. Your team should see what’s wrong, where it is, how severe, and what to do next. That’s hard to manage in folders and emails. A cloud system keeps everyone on the same page.
ABJ’s DataVue is an example of what helps: images auto‑mapped by GPS and time, defect tags by severity and type, user permissions, and side‑by‑side thermal/optical comparisons for pre‑/post‑repair or year‑over‑year checks. You can generate reports, filter by site or asset, and collaborate in real time.
Standards that back your choices
Standards tell you how to prove you made the right call. Use them to set acceptance criteria, choose repair pathways, and structure an evidence pack that satisfies OEMs, owners, and insurers.
- IEC 61400‑24 — lightning protection for blades, nacelles, and towers.
It frames how receptors, down‑conductors, and bonding should be designed, inspected, and maintained after events.
What you use it for: document post‑strike inspections, receptor/tip condition, and any continuity checks done by electrical teams; align thermal/visual findings with LPS paths; decide when to escalate to structural checks.
Typical evidence: photos of receptor/tip, optical/thermal images of flashover zones, location coordinates, strike logs, and a simple pass/fail summary tied to follow‑up actions.
- IEC 61400‑23 — full‑scale structural testing of rotor blades.
It explains how blades are proven and which load cases drive integrity expectations.
What you use it for: language and context when classifying damage near load‑bearing elements (spar caps, shear webs), and when deciding if OEM engineering must review.
Typical evidence: defect descriptions that reference structural elements (not just “crack”), photos/thermal indicating extent relative to webs/caps, and a clear “monitor vs. repair” rationale tied to structural risk.
- DNV‑ST‑0376 — rotor‑blade standard with reliability, inspection, and repair.
What you use it for: defining repair documentation and quality control: materials and lay‑up records, cure parameters, and post‑repair NDT (visual, tap test, UT/IR) with acceptance criteria. It also supports traceability and sign‑off workflows across contractors.
Typical evidence: repair plan and method statement, batch/lot traceability for resins and fabrics, cure logs, calibrated‑instrument records, and post‑repair images/scans attached to the work order.
Use ABJ WindVue + DataVue for same‑day repair decisions
You get speed, depth, and clarity in one workflow. With WindVue, exterior blade inspections finish in about 45 minutes per turbine. Thermal routines tuned for composites resolve ~3–4 mm features and reach up to ~15 cm into the laminate, so hidden bond issues show up early.
Then DataVue turns side‑by‑side thermal and optical evidence, GPS‑mapped annotations, severity tags, and ready‑to‑share reports, severity tags, and ready‑to‑share reports.
You see what’s broken, where it is, and how urgent it is—so planners, techs, and managers act the same day.
FAQs About Wind Turbine Inspections
Can thermal really “see inside” a blade?
Yes, within limits. The workflow reads temperature differences that reveal subsurface flaws. Teams using ABJ Windvue report up to ~15 cm reach and 3–4 mm defect detectability. It’s fast, safe, and incredibly useful for screening.
Why not ultrasound everything?
Because access, couplant, and time add up. Ultrasound shines when you already suspect a critical issue. It gives you depth and sizing so you can plan a precise repair. Use it like a scalpel, not a net.
How often should I inspect?
At least annually for visual + thermal, with higher cadence on harsh sites or older turbines. Treat ultrasound as selective follow-up. Anchor your plan to LEE loss ranges and lightning exposure data to justify your intervals.
Related Reading: How ABJ DataVue Delivers Actionable Intelligence for Utility Firms